

Access Logs
Updated
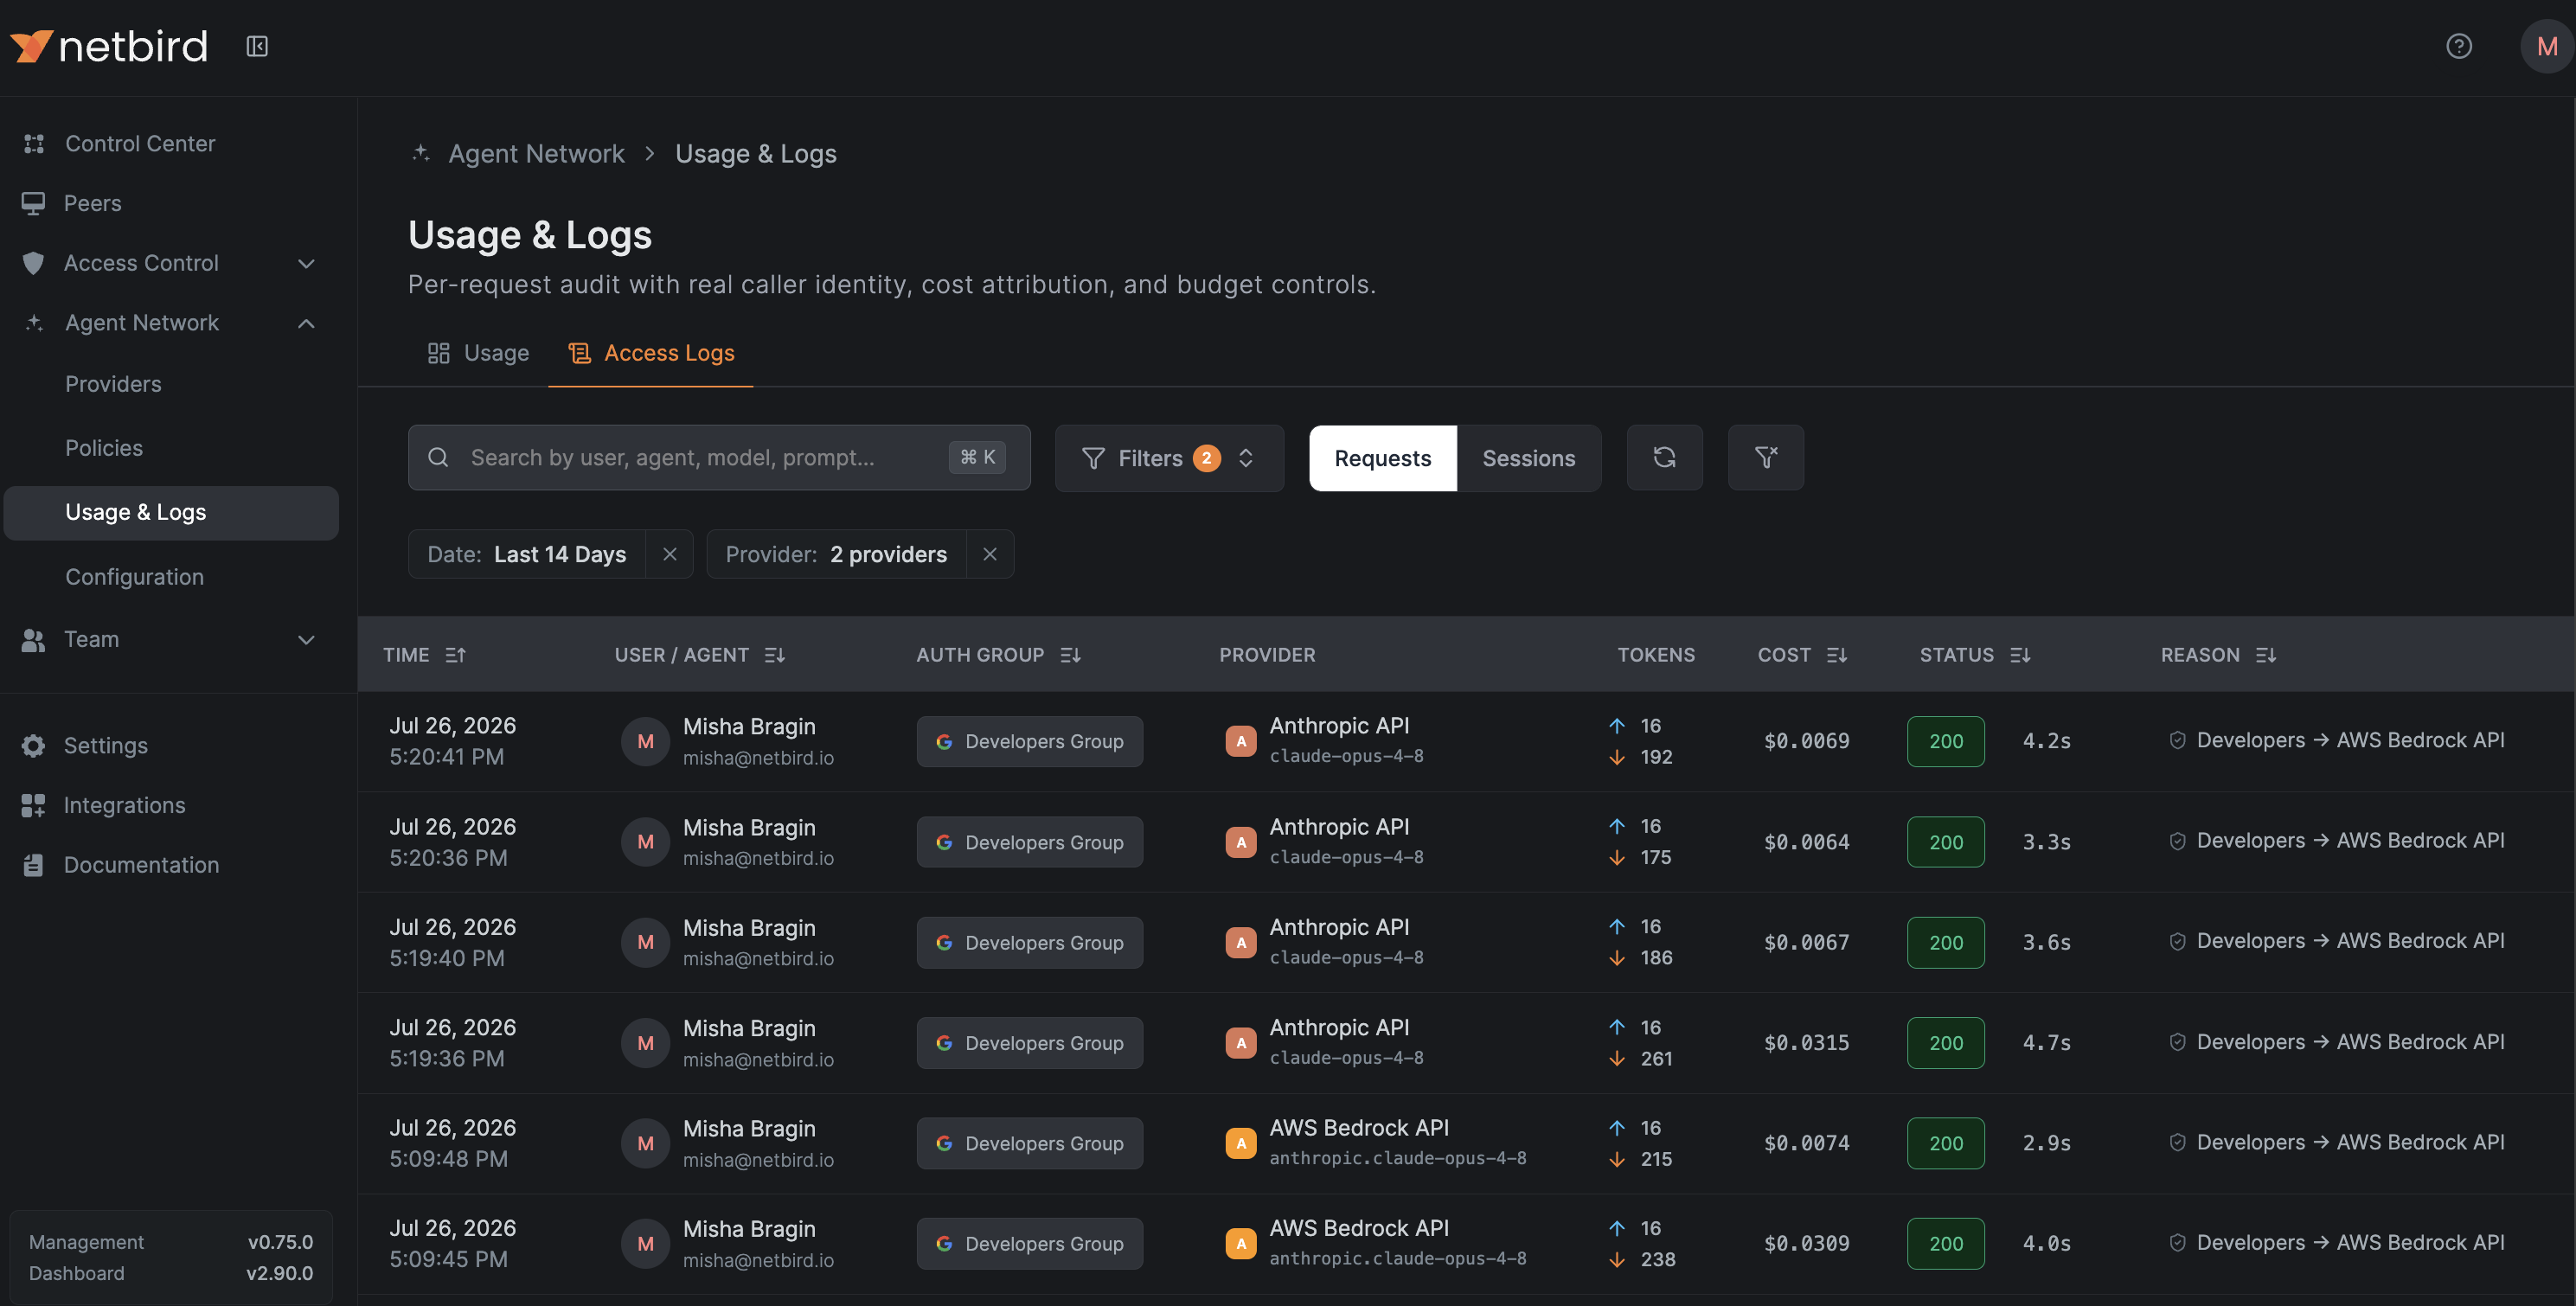
The access log is a per-request audit trail of agent-network traffic. Each entry records the caller, provider and model, tokens and cost, the policy decision, and the reason a request was allowed or denied.
Who can see what
Owner, Admin, Auditor, Agent Network Admin, and Usage Viewer see every caller's requests. Every other user sees only their own requests.
When prompt collection is enabled, access log entries include captured prompts and completions. Any user with one of the roles above can read other users' prompts. See User Roles.
Columns
- Time
- User / Agent: the resolved caller identity.
- Auth Group: the groups that authorized the request.
- Provider: resolved provider and model.
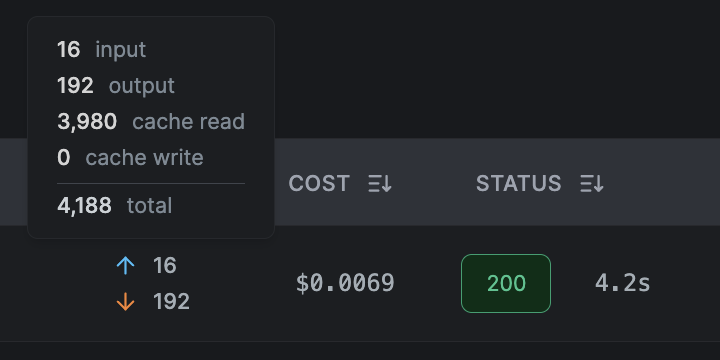
- Tokens: input and output. Hover for the full breakdown, including prompt-cache reads and writes when the request used caching.
- Cost: hover for the per-bucket breakdown of input, output, cache read, and cache write, plus the total.
- Status and Reason: for denials, the mapped policy reason. For allowed requests, a link to the policy that authorized it.
Prompt caching
Agents that use provider-side prompt caching (for example Claude Code caches its system prompt and tools) are billed for cache reads and writes on top of regular input tokens. Agent Network records each bucket per request, so the cache share of your spend is visible instead of hidden inside the total.
Caching applies to the prompt only. Output tokens are generated fresh on every call, so no provider discounts them and there is no cached-output bucket.
Every request is metered against four separately priced token buckets: input (prompt tokens not served from cache), output (the completion), cache read (prompt tokens replayed from the cache, usually about a tenth of the input rate), and cache write (prompt tokens written into the cache, usually 1.25× the input rate).
Because cache writes bill at a premium, the first request of a session can cost noticeably more than its input and output counts alone suggest, while the follow-up requests that read that cache cost much less.
Hovering Tokens shows which buckets a request actually used. Here a follow-up request sent only 16 fresh input tokens but replayed 3,980 tokens from the cache, wrote none, and produced 192 of output, for 4,188 tokens in total:
Hovering Cost breaks the same request down in dollars. Most of the spend here is output, with the 3,980 cached tokens costing only $0.0020 at the reduced cache-read rate:
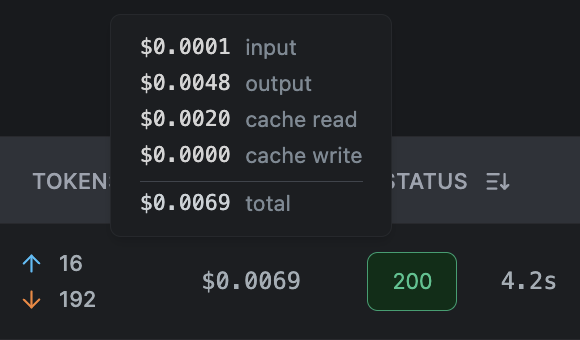
All four buckets are listed even when one costs nothing, so a zero cache-write line tells you this request read the cache rather than populating it. The total is always the sum of the four, so the breakdown and the headline figure can never disagree.
Providers report cache tokens differently, which affects how the Tokens
column reads. Anthropic-shape providers, including Claude on Amazon Bedrock
and Google Vertex AI, report cache reads and writes in addition to
input_tokens, so the total is input + output + both cache buckets. OpenAI
instead counts cached tokens as a subset of the prompt, so they are already
inside input_tokens. The cost breakdown normalizes this: the input line is
always the non-cached remainder, so the same tokens are never billed twice.
The same buckets are summed per session in the Sessions view, and the usage overview shows the cache share of each day's spend.
Sessions
Use the Requests / Sessions switch above the log to change the view. The Sessions view groups related requests into a single session and shows one row per session, most recent activity first, so you can see the latest sessions at a glance.

Some agents keep a session across many separate calls. For example, Claude Code tags every request in a coding session with the same session id. Agent Network groups those requests together, so a whole session shows up as one row with its totals instead of dozens of individual entries.
Each session row summarizes:
- Activity: the session's time span, from its first request to its last.
- User / Agent and Auth Group: the caller and the authorizing groups.
- Provider: the provider and the model(s) used (e.g.
2 models; hover to see the full list). - Requests: how many requests the session made, and over what duration.
- Tokens and Cost: summed across the whole session. Hover for the breakdown, including the session's prompt-cache tokens and the same four cost buckets as a single request.
- Reason: the session's policy decision, a denial if any request in the session was blocked.
Expand a session to see its individual requests, each with its timestamp, path, status, duration, model, tokens, and cost. Expand a request for its full detail, including the prompt and response when prompt capture is on.
Requests from agents that don't set a session id each appear as their own single-request row.
Filtering
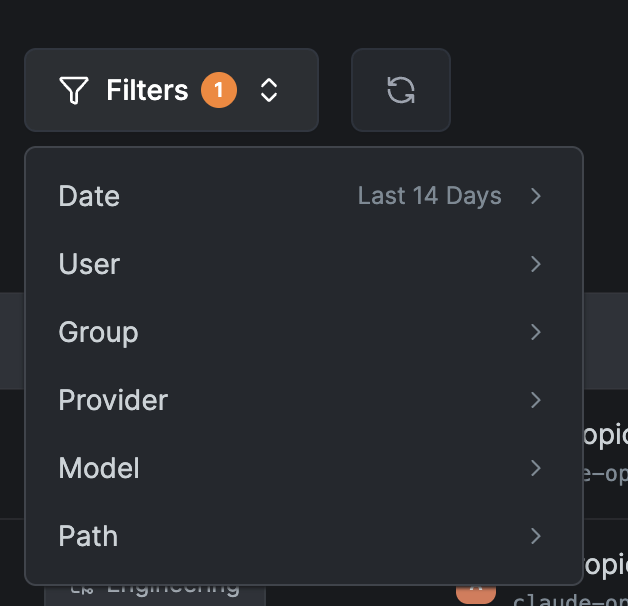
Filter the log by:
- Date: defaults to the last 14 days.
- User
- Group
- Provider
- Model
- Path: match requests whose path starts with a given prefix (e.g.
/v1/messages).
All filtering is applied server-side and works in both the Requests and Sessions views.
Availability
Access logs are retained only when log collection is enabled for the account. Usage and cost are still recorded when it's off. See Log Collection & Retention.